|
Download Data (XLS File) |
|
|||||
|
|||||
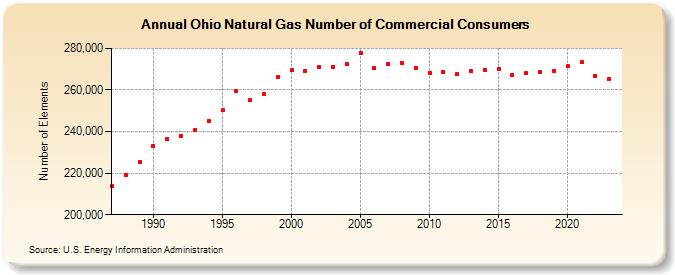
| Ohio Natural Gas Number of Commercial Consumers (Number of Elements) | |||||
| Decade | Year-0 | Year-1 | Year-2 | Year-3 | Year-4 | Year-5 | Year-6 | Year-7 | Year-8 | Year-9 |
|---|---|---|---|---|---|---|---|---|---|---|
| 1980's | 213,601 | 219,257 | 225,347 | |||||||
| 1990's | 233,075 | 236,519 | 237,861 | 240,684 | 245,190 | 250,223 | 259,663 | 254,991 | 258,076 | 266,102 |
| 2000's | 269,561 | 269,327 | 271,160 | 271,203 | 272,445 | 277,767 | 270,552 | 272,555 | 272,899 | 270,596 |
| 2010's | 268,346 | 268,647 | 267,793 | 269,081 | 269,758 | 269,981 | 267,386 | 267,970 | 268,546 | 269,341 |
| 2020's | 271,338 | 273,347 | 266,732 | 265,331 | 266,603 |
| - = No Data Reported; -- = Not Applicable; NA = Not Available; W = Withheld to avoid disclosure of individual company data. |
| Release Date: 6/30/2026 |
| Next Release Date: 7/31/2026 |