|
Download Data (XLS File) |
|
|||||
|
|||||
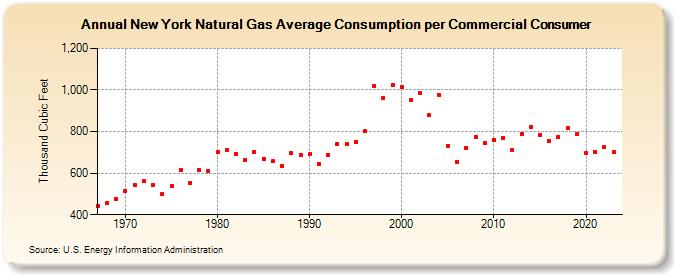
| New York Natural Gas Average Consumption per Commercial Consumer (Thousand Cubic Feet) | |||||
| Decade | Year-0 | Year-1 | Year-2 | Year-3 | Year-4 | Year-5 | Year-6 | Year-7 | Year-8 | Year-9 |
|---|---|---|---|---|---|---|---|---|---|---|
| 1960's | 442 | 457 | 475 | |||||||
| 1970's | 515 | 543 | 560 | 545 | 499 | 539 | 616 | 552 | 616 | 608 |
| 1980's | 700 | 709 | 692 | 663 | 701 | 670 | 657 | 636 | 696 | 689 |
| 1990's | 692 | 642 | 687 | 741 | 740 | 749 | 801 | 1,020 | 962 | 1,023 |
| 2000's | 1,012 | 954 | 986 | 878 | 977 | 732 | 654 | 723 | 776 | 747 |
| 2010's | 761 | 770 | 712 | 789 | 821 | 783 | 753 | 774 | 815 | 787 |
| 2020's | 695 | 702 | 724 | 701 | 675 |
| - = No Data Reported; -- = Not Applicable; NA = Not Available; W = Withheld to avoid disclosure of individual company data. |
| Release Date: 6/30/2026 |
| Next Release Date: 7/31/2026 |