|
Download Data (XLS File) |
|
|||||
|
|||||
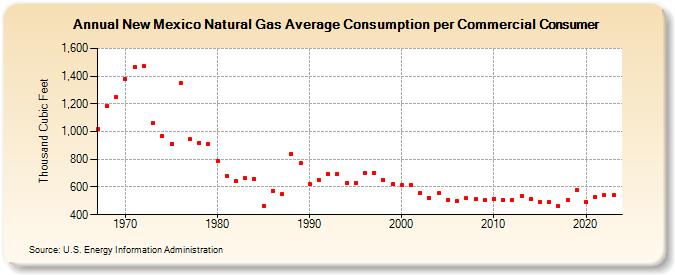
| New Mexico Natural Gas Average Consumption per Commercial Consumer (Thousand Cubic Feet) | |||||
| Decade | Year-0 | Year-1 | Year-2 | Year-3 | Year-4 | Year-5 | Year-6 | Year-7 | Year-8 | Year-9 |
|---|---|---|---|---|---|---|---|---|---|---|
| 1960's | 1,017 | 1,181 | 1,247 | |||||||
| 1970's | 1,376 | 1,468 | 1,471 | 1,065 | 970 | 912 | 1,348 | 944 | 918 | 909 |
| 1980's | 790 | 682 | 642 | 662 | 659 | 465 | 573 | 547 | 840 | 770 |
| 1990's | 623 | 647 | 692 | 695 | 627 | 628 | 700 | 704 | 647 | 618 |
| 2000's | 612 | 612 | 560 | 522 | 554 | 507 | 496 | 518 | 511 | 506 |
| 2010's | 516 | 507 | 509 | 534 | 512 | 495 | 492 | 463 | 507 | 580 |
| 2020's | 492 | 526 | 540 | 541 | 530 |
| - = No Data Reported; -- = Not Applicable; NA = Not Available; W = Withheld to avoid disclosure of individual company data. |
| Release Date: 6/30/2026 |
| Next Release Date: 7/31/2026 |