|
Download Data (XLS File) |
|
|||||
|
|||||
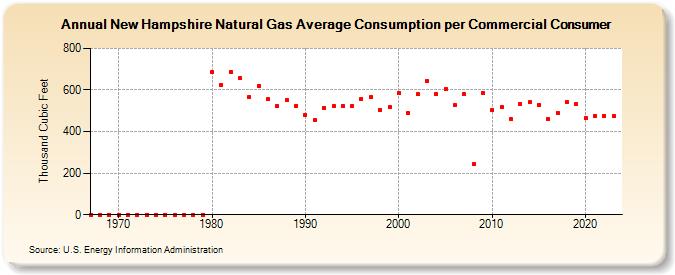
| New Hampshire Natural Gas Average Consumption per Commercial Consumer (Thousand Cubic Feet) | |||||
| Decade | Year-0 | Year-1 | Year-2 | Year-3 | Year-4 | Year-5 | Year-6 | Year-7 | Year-8 | Year-9 |
|---|---|---|---|---|---|---|---|---|---|---|
| 1960's | 0 | 0 | 0 | |||||||
| 1970's | 0 | 0 | 0 | 0 | 0 | 0 | 0 | 0 | 0 | 0 |
| 1980's | 686 | 625 | 688 | 657 | 565 | 619 | 555 | 521 | 550 | 525 |
| 1990's | 482 | 454 | 515 | 524 | 524 | 523 | 557 | 566 | 504 | 518 |
| 2000's | 585 | 488 | 580 | 643 | 580 | 605 | 526 | 580 | 243 | 587 |
| 2010's | 505 | 517 | 458 | 532 | 540 | 530 | 458 | 491 | 542 | 531 |
| 2020's | 464 | 476 | 475 | 474 | 445 |
| - = No Data Reported; -- = Not Applicable; NA = Not Available; W = Withheld to avoid disclosure of individual company data. |
| Release Date: 6/30/2026 |
| Next Release Date: 7/31/2026 |