|
Download Data (XLS File) |
|
|||||
|
|||||
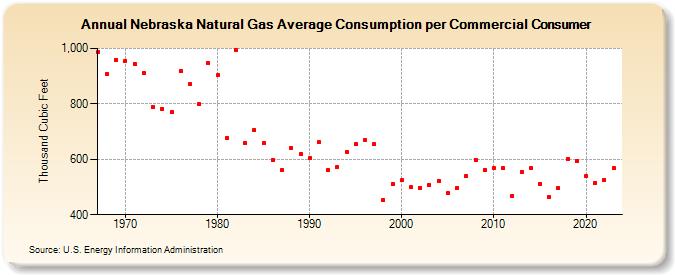
| Nebraska Natural Gas Average Consumption per Commercial Consumer (Thousand Cubic Feet) | |||||
| Decade | Year-0 | Year-1 | Year-2 | Year-3 | Year-4 | Year-5 | Year-6 | Year-7 | Year-8 | Year-9 |
|---|---|---|---|---|---|---|---|---|---|---|
| 1960's | 987 | 908 | 959 | |||||||
| 1970's | 956 | 945 | 910 | 790 | 783 | 770 | 919 | 870 | 799 | 946 |
| 1980's | 903 | 677 | 995 | 659 | 706 | 657 | 596 | 563 | 642 | 619 |
| 1990's | 604 | 661 | 562 | 573 | 628 | 654 | 668 | 655 | 453 | 511 |
| 2000's | 524 | 499 | 498 | 507 | 523 | 477 | 497 | 539 | 599 | 563 |
| 2010's | 569 | 568 | 468 | 555 | 567 | 512 | 463 | 496 | 601 | 592 |
| 2020's | 538 | 516 | 527 | 568 | 530 |
| - = No Data Reported; -- = Not Applicable; NA = Not Available; W = Withheld to avoid disclosure of individual company data. |
| Release Date: 6/30/2026 |
| Next Release Date: 7/31/2026 |