|
Download Data (XLS File) |
|
|||||
|
|||||
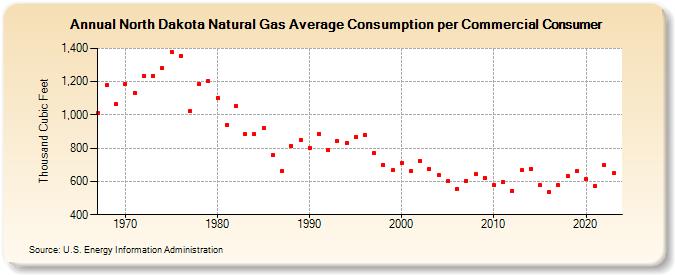
| North Dakota Natural Gas Average Consumption per Commercial Consumer (Thousand Cubic Feet) | |||||
| Decade | Year-0 | Year-1 | Year-2 | Year-3 | Year-4 | Year-5 | Year-6 | Year-7 | Year-8 | Year-9 |
|---|---|---|---|---|---|---|---|---|---|---|
| 1960's | 1,010 | 1,179 | 1,063 | |||||||
| 1970's | 1,188 | 1,132 | 1,234 | 1,234 | 1,281 | 1,381 | 1,356 | 1,021 | 1,185 | 1,204 |
| 1980's | 1,103 | 942 | 1,053 | 883 | 884 | 920 | 757 | 664 | 812 | 852 |
| 1990's | 803 | 888 | 790 | 841 | 833 | 869 | 881 | 771 | 699 | 666 |
| 2000's | 712 | 664 | 725 | 676 | 637 | 600 | 555 | 605 | 642 | 623 |
| 2010's | 578 | 596 | 543 | 667 | 677 | 577 | 536 | 577 | 632 | 664 |
| 2020's | 615 | 572 | 696 | 649 | 587 |
| - = No Data Reported; -- = Not Applicable; NA = Not Available; W = Withheld to avoid disclosure of individual company data. |
| Release Date: 6/30/2026 |
| Next Release Date: 7/31/2026 |