|
Download Data (XLS File) |
|
|||||
|
|||||
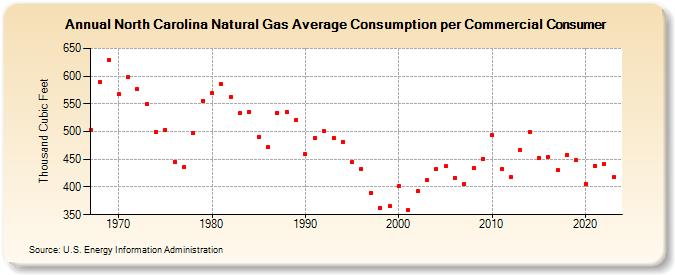
| North Carolina Natural Gas Average Consumption per Commercial Consumer (Thousand Cubic Feet) | |||||
| Decade | Year-0 | Year-1 | Year-2 | Year-3 | Year-4 | Year-5 | Year-6 | Year-7 | Year-8 | Year-9 |
|---|---|---|---|---|---|---|---|---|---|---|
| 1960's | 503 | 589 | 629 | |||||||
| 1970's | 567 | 598 | 576 | 549 | 500 | 503 | 445 | 436 | 497 | 556 |
| 1980's | 569 | 586 | 563 | 533 | 536 | 491 | 472 | 534 | 535 | 521 |
| 1990's | 459 | 489 | 501 | 489 | 482 | 445 | 433 | 389 | 363 | 365 |
| 2000's | 401 | 358 | 392 | 412 | 432 | 437 | 417 | 405 | 434 | 451 |
| 2010's | 494 | 432 | 418 | 467 | 499 | 452 | 454 | 430 | 458 | 448 |
| 2020's | 406 | 438 | 441 | 418 | 501 |
| - = No Data Reported; -- = Not Applicable; NA = Not Available; W = Withheld to avoid disclosure of individual company data. |
| Release Date: 6/30/2026 |
| Next Release Date: 7/31/2026 |