|
Download Data (XLS File) |
|
|||||
|
|||||
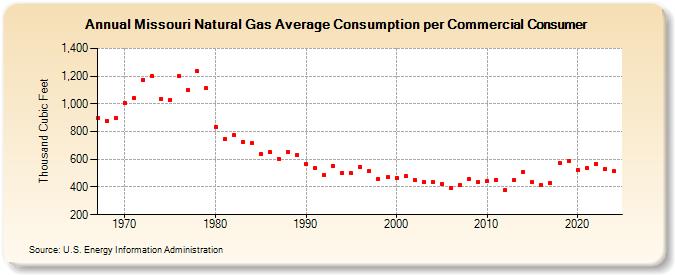
| Missouri Natural Gas Average Consumption per Commercial Consumer (Thousand Cubic Feet) | |||||
| Decade | Year-0 | Year-1 | Year-2 | Year-3 | Year-4 | Year-5 | Year-6 | Year-7 | Year-8 | Year-9 |
|---|---|---|---|---|---|---|---|---|---|---|
| 1960's | 897 | 877 | 898 | |||||||
| 1970's | 1,007 | 1,041 | 1,175 | 1,198 | 1,038 | 1,031 | 1,200 | 1,098 | 1,234 | 1,113 |
| 1980's | 836 | 744 | 772 | 723 | 715 | 635 | 651 | 602 | 652 | 632 |
| 1990's | 565 | 537 | 487 | 555 | 500 | 499 | 546 | 515 | 458 | 473 |
| 2000's | 468 | 477 | 449 | 439 | 437 | 425 | 395 | 414 | 459 | 437 |
| 2010's | 441 | 451 | 378 | 453 | 509 | 434 | 411 | 427 | 572 | 591 |
| 2020's | 524 | 539 | 567 | 531 | 513 |
| - = No Data Reported; -- = Not Applicable; NA = Not Available; W = Withheld to avoid disclosure of individual company data. |
| Release Date: 6/30/2026 |
| Next Release Date: 7/31/2026 |