|
Download Data (XLS File) |
|
|||||
|
|||||
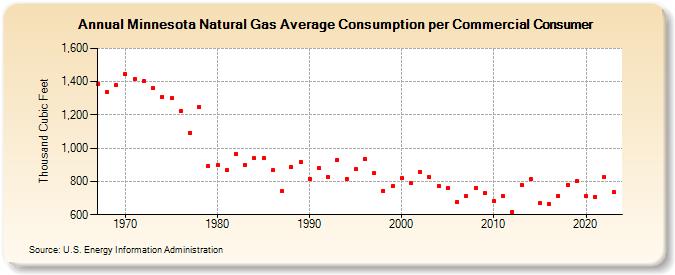
| Minnesota Natural Gas Average Consumption per Commercial Consumer (Thousand Cubic Feet) | |||||
| Decade | Year-0 | Year-1 | Year-2 | Year-3 | Year-4 | Year-5 | Year-6 | Year-7 | Year-8 | Year-9 |
|---|---|---|---|---|---|---|---|---|---|---|
| 1960's | 1,386 | 1,337 | 1,377 | |||||||
| 1970's | 1,445 | 1,416 | 1,403 | 1,360 | 1,310 | 1,299 | 1,222 | 1,094 | 1,248 | 890 |
| 1980's | 898 | 867 | 965 | 899 | 938 | 939 | 866 | 742 | 886 | 917 |
| 1990's | 817 | 882 | 826 | 931 | 816 | 873 | 934 | 849 | 742 | 772 |
| 2000's | 818 | 789 | 857 | 824 | 772 | 759 | 675 | 711 | 761 | 730 |
| 2010's | 681 | 710 | 619 | 781 | 813 | 670 | 667 | 714 | 781 | 801 |
| 2020's | 710 | 709 | 827 | 736 | 658 |
| - = No Data Reported; -- = Not Applicable; NA = Not Available; W = Withheld to avoid disclosure of individual company data. |
| Release Date: 6/30/2026 |
| Next Release Date: 7/31/2026 |