|
Download Data (XLS File) |
|
|||||
|
|||||
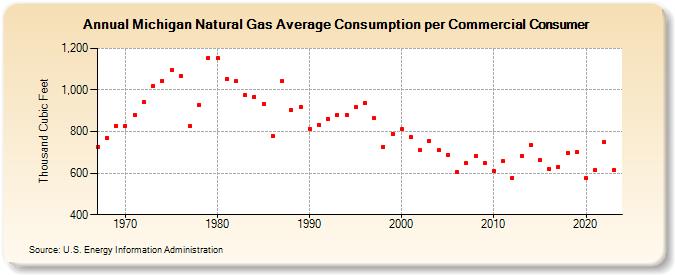
| Michigan Natural Gas Average Consumption per Commercial Consumer (Thousand Cubic Feet) | |||||
| Decade | Year-0 | Year-1 | Year-2 | Year-3 | Year-4 | Year-5 | Year-6 | Year-7 | Year-8 | Year-9 |
|---|---|---|---|---|---|---|---|---|---|---|
| 1960's | 728 | 771 | 828 | |||||||
| 1970's | 829 | 881 | 941 | 1,018 | 1,045 | 1,096 | 1,067 | 826 | 928 | 1,154 |
| 1980's | 1,153 | 1,053 | 1,043 | 975 | 968 | 933 | 779 | 1,042 | 903 | 920 |
| 1990's | 814 | 832 | 862 | 882 | 882 | 916 | 937 | 863 | 728 | 790 |
| 2000's | 810 | 772 | 710 | 756 | 709 | 689 | 604 | 647 | 682 | 649 |
| 2010's | 611 | 656 | 578 | 683 | 736 | 662 | 619 | 630 | 699 | 700 |
| 2020's | 575 | 614 | 751 | 614 | 578 |
| - = No Data Reported; -- = Not Applicable; NA = Not Available; W = Withheld to avoid disclosure of individual company data. |
| Release Date: 6/30/2026 |
| Next Release Date: 7/31/2026 |