|
Download Data (XLS File) |
|
|||||
|
|||||
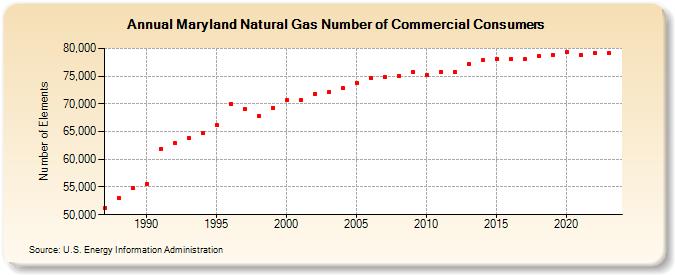
| Maryland Natural Gas Number of Commercial Consumers (Number of Elements) | |||||
| Decade | Year-0 | Year-1 | Year-2 | Year-3 | Year-4 | Year-5 | Year-6 | Year-7 | Year-8 | Year-9 |
|---|---|---|---|---|---|---|---|---|---|---|
| 1980's | 51,252 | 53,045 | 54,740 | |||||||
| 1990's | 55,576 | 61,878 | 62,858 | 63,767 | 64,698 | 66,094 | 69,991 | 69,056 | 67,850 | 69,301 |
| 2000's | 70,671 | 70,691 | 71,824 | 72,076 | 72,809 | 73,780 | 74,584 | 74,856 | 75,053 | 75,771 |
| 2010's | 75,192 | 75,788 | 75,799 | 77,117 | 77,846 | 78,138 | 78,047 | 78,005 | 78,589 | 78,882 |
| 2020's | 79,339 | 78,768 | 79,177 | 79,222 | 79,140 |
| - = No Data Reported; -- = Not Applicable; NA = Not Available; W = Withheld to avoid disclosure of individual company data. |
| Release Date: 6/30/2026 |
| Next Release Date: 7/31/2026 |