|
Download Data (XLS File) |
|
|||||
|
|||||
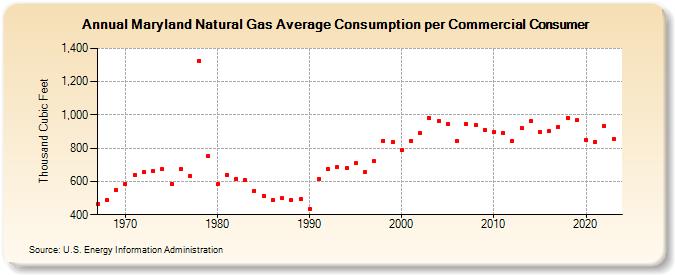
| Maryland Natural Gas Average Consumption per Commercial Consumer (Thousand Cubic Feet) | |||||
| Decade | Year-0 | Year-1 | Year-2 | Year-3 | Year-4 | Year-5 | Year-6 | Year-7 | Year-8 | Year-9 |
|---|---|---|---|---|---|---|---|---|---|---|
| 1960's | 462 | 491 | 550 | |||||||
| 1970's | 586 | 640 | 656 | 661 | 673 | 585 | 673 | 633 | 1,327 | 751 |
| 1980's | 583 | 641 | 615 | 610 | 545 | 513 | 486 | 498 | 488 | 492 |
| 1990's | 433 | 616 | 676 | 684 | 682 | 709 | 655 | 721 | 846 | 838 |
| 2000's | 788 | 846 | 891 | 979 | 964 | 945 | 843 | 947 | 938 | 912 |
| 2010's | 898 | 891 | 846 | 923 | 961 | 898 | 903 | 927 | 984 | 968 |
| 2020's | 852 | 840 | 934 | 858 | 874 |
| - = No Data Reported; -- = Not Applicable; NA = Not Available; W = Withheld to avoid disclosure of individual company data. |
| Release Date: 6/30/2026 |
| Next Release Date: 7/31/2026 |