|
Download Data (XLS File) |
|
|||||
|
|||||
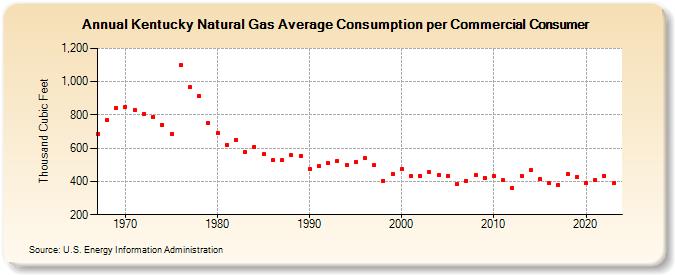
| Kentucky Natural Gas Average Consumption per Commercial Consumer (Thousand Cubic Feet) | |||||
| Decade | Year-0 | Year-1 | Year-2 | Year-3 | Year-4 | Year-5 | Year-6 | Year-7 | Year-8 | Year-9 |
|---|---|---|---|---|---|---|---|---|---|---|
| 1960's | 688 | 768 | 839 | |||||||
| 1970's | 849 | 830 | 808 | 790 | 742 | 687 | 1,100 | 965 | 915 | 750 |
| 1980's | 691 | 617 | 651 | 576 | 610 | 563 | 527 | 528 | 558 | 556 |
| 1990's | 474 | 492 | 510 | 525 | 499 | 518 | 539 | 497 | 405 | 446 |
| 2000's | 474 | 431 | 434 | 454 | 438 | 433 | 382 | 404 | 437 | 423 |
| 2010's | 435 | 407 | 361 | 435 | 467 | 412 | 390 | 380 | 443 | 429 |
| 2020's | 388 | 410 | 435 | 388 | 397 |
| - = No Data Reported; -- = Not Applicable; NA = Not Available; W = Withheld to avoid disclosure of individual company data. |
| Release Date: 6/30/2026 |
| Next Release Date: 7/31/2026 |