|
Download Data (XLS File) |
|
|||||
|
|||||
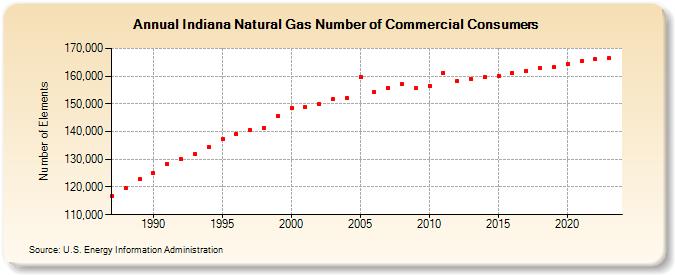
| Indiana Natural Gas Number of Commercial Consumers (Number of Elements) | |||||
| Decade | Year-0 | Year-1 | Year-2 | Year-3 | Year-4 | Year-5 | Year-6 | Year-7 | Year-8 | Year-9 |
|---|---|---|---|---|---|---|---|---|---|---|
| 1980's | 116,571 | 119,458 | 122,803 | |||||||
| 1990's | 124,919 | 128,223 | 129,973 | 131,925 | 134,336 | 137,162 | 139,097 | 140,515 | 141,307 | 145,631 |
| 2000's | 148,411 | 148,830 | 150,092 | 151,586 | 151,943 | 159,649 | 154,322 | 155,885 | 157,223 | 155,615 |
| 2010's | 156,557 | 161,293 | 158,213 | 158,965 | 159,596 | 160,051 | 161,139 | 161,941 | 162,938 | 163,285 |
| 2020's | 164,335 | 165,411 | 166,132 | 166,424 | 167,336 |
| - = No Data Reported; -- = Not Applicable; NA = Not Available; W = Withheld to avoid disclosure of individual company data. |
| Release Date: 6/30/2026 |
| Next Release Date: 7/31/2026 |