|
Download Data (XLS File) |
|
|||||
|
|||||
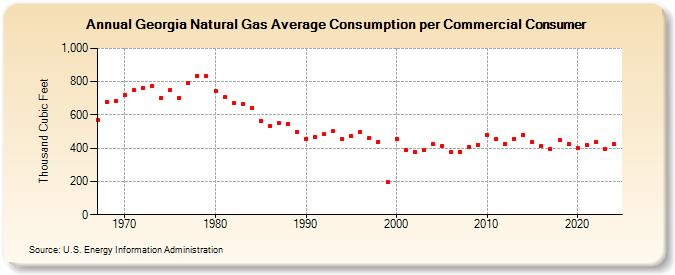
| Georgia Natural Gas Average Consumption per Commercial Consumer (Thousand Cubic Feet) | |||||
| Decade | Year-0 | Year-1 | Year-2 | Year-3 | Year-4 | Year-5 | Year-6 | Year-7 | Year-8 | Year-9 |
|---|---|---|---|---|---|---|---|---|---|---|
| 1960's | 570 | 680 | 685 | |||||||
| 1970's | 717 | 748 | 763 | 775 | 703 | 749 | 702 | 790 | 837 | 832 |
| 1980's | 744 | 705 | 671 | 667 | 644 | 566 | 536 | 552 | 547 | 498 |
| 1990's | 457 | 465 | 483 | 501 | 458 | 471 | 498 | 464 | 440 | 194 |
| 2000's | 458 | 388 | 379 | 387 | 427 | 412 | 377 | 380 | 406 | 421 |
| 2010's | 482 | 458 | 428 | 454 | 482 | 436 | 413 | 396 | 450 | 424 |
| 2020's | 402 | 419 | 440 | 394 | 423 |
| - = No Data Reported; -- = Not Applicable; NA = Not Available; W = Withheld to avoid disclosure of individual company data. |
| Release Date: 6/30/2026 |
| Next Release Date: 7/31/2026 |