|
Download Data (XLS File) |
|
|||||
|
|||||
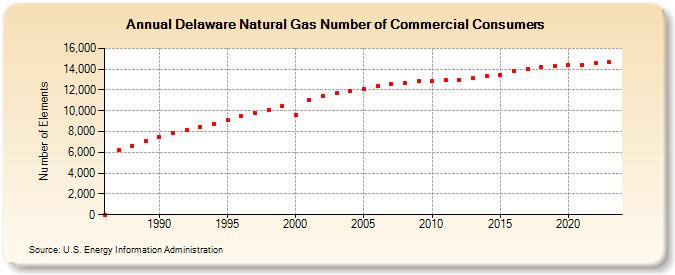
| Delaware Natural Gas Number of Commercial Consumers (Number of Elements) | |||||
| Decade | Year-0 | Year-1 | Year-2 | Year-3 | Year-4 | Year-5 | Year-6 | Year-7 | Year-8 | Year-9 |
|---|---|---|---|---|---|---|---|---|---|---|
| 1980's | 6 | 6,180 | 6,566 | 7,074 | ||||||
| 1990's | 7,485 | 7,895 | 8,173 | 8,409 | 8,721 | 9,133 | 9,518 | 9,807 | 10,081 | 10,441 |
| 2000's | 9,639 | 11,075 | 11,463 | 11,682 | 11,921 | 12,070 | 12,345 | 12,576 | 12,703 | 12,839 |
| 2010's | 12,861 | 12,931 | 12,997 | 13,163 | 13,352 | 13,430 | 13,786 | 14,000 | 14,255 | 14,343 |
| 2020's | 14,415 | 14,432 | 14,625 | 14,659 | 14,815 |
| - = No Data Reported; -- = Not Applicable; NA = Not Available; W = Withheld to avoid disclosure of individual company data. |
| Release Date: 6/30/2026 |
| Next Release Date: 7/31/2026 |