|
Download Data (XLS File) |
|
|||||
|
|||||
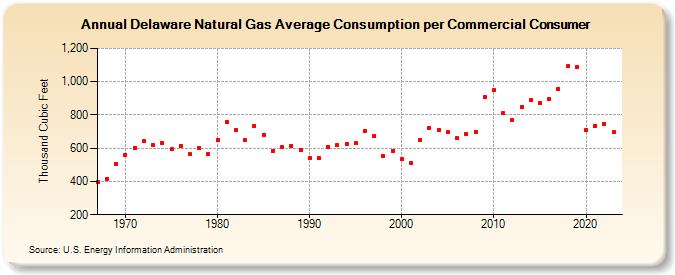
| Delaware Natural Gas Average Consumption per Commercial Consumer (Thousand Cubic Feet) | |||||
| Decade | Year-0 | Year-1 | Year-2 | Year-3 | Year-4 | Year-5 | Year-6 | Year-7 | Year-8 | Year-9 |
|---|---|---|---|---|---|---|---|---|---|---|
| 1960's | 394 | 417 | 505 | |||||||
| 1970's | 561 | 602 | 641 | 619 | 634 | 593 | 616 | 563 | 601 | 568 |
| 1980's | 649 | 757 | 710 | 650 | 735 | 682 | 586 | 605 | 615 | 591 |
| 1990's | 540 | 539 | 607 | 618 | 626 | 629 | 703 | 674 | 554 | 586 |
| 2000's | 532 | 513 | 652 | 722 | 710 | 695 | 659 | 686 | 698 | 910 |
| 2010's | 948 | 810 | 772 | 849 | 890 | 873 | 895 | 956 | 1,094 | 1,087 |
| 2020's | 711 | 736 | 745 | 695 | 701 |
| - = No Data Reported; -- = Not Applicable; NA = Not Available; W = Withheld to avoid disclosure of individual company data. |
| Release Date: 6/30/2026 |
| Next Release Date: 7/31/2026 |