|
Download Data (XLS File) |
|
|||||
|
|||||
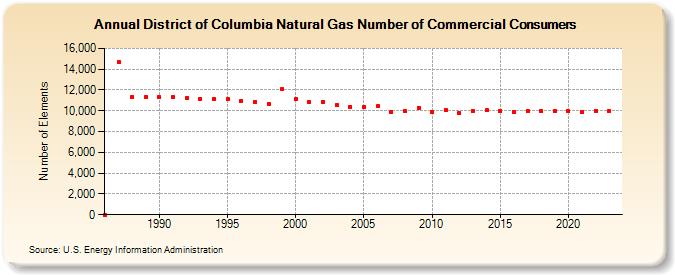
| District of Columbia Natural Gas Number of Commercial Consumers (Number of Elements) | |||||
| Decade | Year-0 | Year-1 | Year-2 | Year-3 | Year-4 | Year-5 | Year-6 | Year-7 | Year-8 | Year-9 |
|---|---|---|---|---|---|---|---|---|---|---|
| 1980's | 11 | 14,683 | 11,370 | 11,354 | ||||||
| 1990's | 11,322 | 11,318 | 11,206 | 11,133 | 11,132 | 11,089 | 10,952 | 10,874 | 10,658 | 12,108 |
| 2000's | 11,106 | 10,816 | 10,870 | 10,565 | 10,406 | 10,381 | 10,410 | 9,915 | 10,024 | 10,288 |
| 2010's | 9,879 | 10,050 | 9,771 | 9,963 | 10,049 | 9,975 | 9,893 | 9,945 | 9,978 | 9,986 |
| 2020's | 9,952 | 9,913 | 9,979 | 9,939 | 10,040 |
| - = No Data Reported; -- = Not Applicable; NA = Not Available; W = Withheld to avoid disclosure of individual company data. |
| Release Date: 6/30/2026 |
| Next Release Date: 7/31/2026 |