|
Download Data (XLS File) |
|
|||||
|
|||||
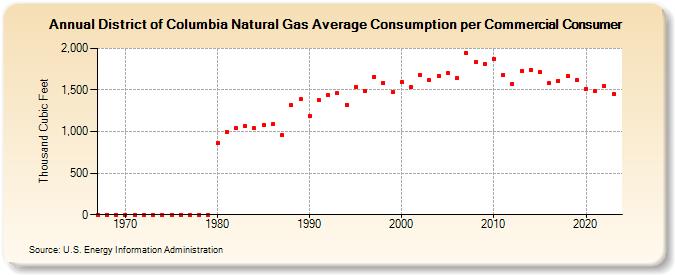
| District of Columbia Natural Gas Average Consumption per Commercial Consumer (Thousand Cubic Feet) | |||||
| Decade | Year-0 | Year-1 | Year-2 | Year-3 | Year-4 | Year-5 | Year-6 | Year-7 | Year-8 | Year-9 |
|---|---|---|---|---|---|---|---|---|---|---|
| 1960's | 0 | 0 | 0 | |||||||
| 1970's | 0 | 0 | 0 | 0 | 0 | 0 | 0 | 0 | 0 | 0 |
| 1980's | 860 | 1,000 | 1,042 | 1,061 | 1,037 | 1,084 | 1,085 | 953 | 1,320 | 1,386 |
| 1990's | 1,190 | 1,374 | 1,437 | 1,458 | 1,324 | 1,536 | 1,493 | 1,656 | 1,582 | 1,473 |
| 2000's | 1,596 | 1,530 | 1,686 | 1,618 | 1,671 | 1,703 | 1,643 | 1,946 | 1,837 | 1,818 |
| 2010's | 1,877 | 1,681 | 1,572 | 1,730 | 1,741 | 1,716 | 1,582 | 1,613 | 1,666 | 1,615 |
| 2020's | 1,514 | 1,489 | 1,552 | 1,457 | 1,421 |
| - = No Data Reported; -- = Not Applicable; NA = Not Available; W = Withheld to avoid disclosure of individual company data. |
| Release Date: 6/30/2026 |
| Next Release Date: 7/31/2026 |