|
Download Data (XLS File) |
|
|||||
|
|||||
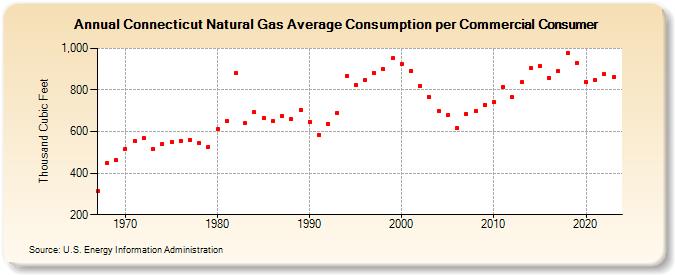
| Connecticut Natural Gas Average Consumption per Commercial Consumer (Thousand Cubic Feet) | |||||
| Decade | Year-0 | Year-1 | Year-2 | Year-3 | Year-4 | Year-5 | Year-6 | Year-7 | Year-8 | Year-9 |
|---|---|---|---|---|---|---|---|---|---|---|
| 1960's | 312 | 449 | 461 | |||||||
| 1970's | 518 | 554 | 567 | 514 | 542 | 549 | 556 | 560 | 546 | 526 |
| 1980's | 611 | 651 | 881 | 639 | 694 | 665 | 650 | 675 | 659 | 704 |
| 1990's | 648 | 584 | 637 | 690 | 868 | 825 | 846 | 884 | 899 | 952 |
| 2000's | 925 | 891 | 821 | 765 | 699 | 680 | 616 | 686 | 699 | 729 |
| 2010's | 741 | 815 | 764 | 836 | 905 | 914 | 859 | 890 | 979 | 930 |
| 2020's | 839 | 848 | 875 | 862 | 878 |
| - = No Data Reported; -- = Not Applicable; NA = Not Available; W = Withheld to avoid disclosure of individual company data. |
| Release Date: 6/30/2026 |
| Next Release Date: 7/31/2026 |