|
Download Data (XLS File) |
|
|||||
|
|||||
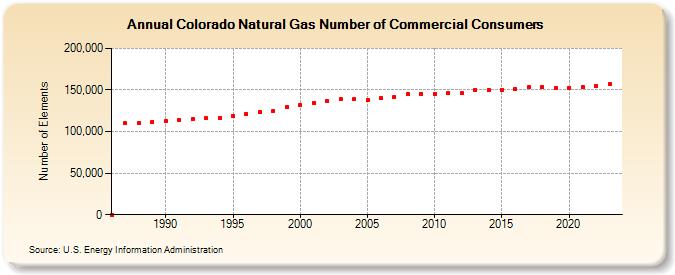
| Colorado Natural Gas Number of Commercial Consumers (Number of Elements) | |||||
| Decade | Year-0 | Year-1 | Year-2 | Year-3 | Year-4 | Year-5 | Year-6 | Year-7 | Year-8 | Year-9 |
|---|---|---|---|---|---|---|---|---|---|---|
| 1980's | 108 | 109,770 | 110,769 | 112,004 | ||||||
| 1990's | 112,661 | 113,945 | 114,898 | 115,924 | 115,994 | 118,502 | 121,221 | 123,580 | 125,178 | 129,041 |
| 2000's | 131,613 | 134,393 | 136,489 | 138,621 | 138,543 | 137,513 | 139,746 | 141,420 | 144,719 | 145,624 |
| 2010's | 145,460 | 145,837 | 145,960 | 150,145 | 150,235 | 150,540 | 151,401 | 153,312 | 153,446 | 152,220 |
| 2020's | 152,693 | 153,435 | 155,259 | 157,107 | 157,953 |
| - = No Data Reported; -- = Not Applicable; NA = Not Available; W = Withheld to avoid disclosure of individual company data. |
| Release Date: 6/30/2026 |
| Next Release Date: 7/31/2026 |