|
Download Data (XLS File) |
|
|||||
|
|||||
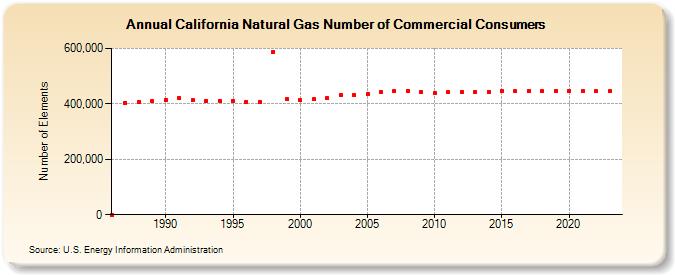
| California Natural Gas Number of Commercial Consumers (Number of Elements) | |||||
| Decade | Year-0 | Year-1 | Year-2 | Year-3 | Year-4 | Year-5 | Year-6 | Year-7 | Year-8 | Year-9 |
|---|---|---|---|---|---|---|---|---|---|---|
| 1980's | 413 | 404,507 | 407,435 | 410,231 | ||||||
| 1990's | 415,073 | 421,278 | 412,467 | 411,648 | 411,140 | 411,535 | 408,294 | 406,803 | 588,224 | 416,791 |
| 2000's | 413,003 | 416,036 | 420,690 | 431,795 | 432,367 | 434,899 | 442,052 | 446,267 | 447,160 | 441,806 |
| 2010's | 439,572 | 440,990 | 442,708 | 444,342 | 443,115 | 446,511 | 444,960 | 446,646 | 445,408 | 447,779 |
| 2020's | 447,120 | 444,760 | 444,538 | 444,853 | 444,777 |
| - = No Data Reported; -- = Not Applicable; NA = Not Available; W = Withheld to avoid disclosure of individual company data. |
| Release Date: 6/30/2026 |
| Next Release Date: 7/31/2026 |