|
Download Data (XLS File) |
|
|||||
|
|||||
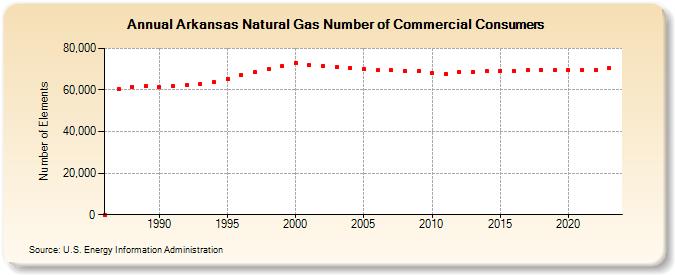
| Arkansas Natural Gas Number of Commercial Consumers (Number of Elements) | |||||
| Decade | Year-0 | Year-1 | Year-2 | Year-3 | Year-4 | Year-5 | Year-6 | Year-7 | Year-8 | Year-9 |
|---|---|---|---|---|---|---|---|---|---|---|
| 1980's | 60 | 60,355 | 61,630 | 61,848 | ||||||
| 1990's | 61,530 | 61,731 | 62,221 | 62,952 | 63,821 | 65,490 | 67,293 | 68,413 | 69,974 | 71,389 |
| 2000's | 72,933 | 71,875 | 71,530 | 71,016 | 70,655 | 69,990 | 69,475 | 69,495 | 69,144 | 69,043 |
| 2010's | 67,987 | 67,815 | 68,765 | 68,791 | 69,011 | 69,265 | 69,329 | 69,445 | 69,528 | 69,425 |
| 2020's | 69,646 | 69,792 | 69,715 | 70,350 | 70,098 |
| - = No Data Reported; -- = Not Applicable; NA = Not Available; W = Withheld to avoid disclosure of individual company data. |
| Release Date: 6/30/2026 |
| Next Release Date: 7/31/2026 |