|
Download Data (XLS File) |
|
|||||
|
|||||
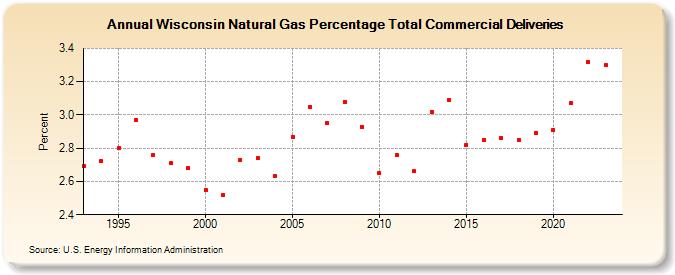
| Wisconsin Natural Gas Percentage Total Commercial Deliveries (Percent) | |||||
| Decade | Year-0 | Year-1 | Year-2 | Year-3 | Year-4 | Year-5 | Year-6 | Year-7 | Year-8 | Year-9 |
|---|---|---|---|---|---|---|---|---|---|---|
| 1990's | 2.69 | 2.72 | 2.80 | 2.97 | 2.76 | 2.71 | 2.68 | |||
| 2000's | 2.55 | 2.52 | 2.73 | 2.74 | 2.63 | 2.87 | 3.05 | 2.95 | 3.08 | 2.93 |
| 2010's | 2.65 | 2.76 | 2.66 | 3.02 | 3.09 | 2.82 | 2.85 | 2.86 | 2.85 | 2.89 |
| 2020's | 2.91 | 3.07 | 3.32 | 3.31 | 3.21 |
| - = No Data Reported; -- = Not Applicable; NA = Not Available; W = Withheld to avoid disclosure of individual company data. |
| Release Date: 5/29/2026 |
| Next Release Date: 6/30/2026 |