|
Download Data (XLS File) |
|
|||||
|
|||||
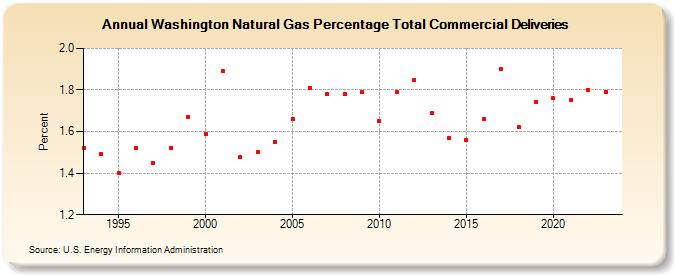
| Washington Natural Gas Percentage Total Commercial Deliveries (Percent) | |||||
| Decade | Year-0 | Year-1 | Year-2 | Year-3 | Year-4 | Year-5 | Year-6 | Year-7 | Year-8 | Year-9 |
|---|---|---|---|---|---|---|---|---|---|---|
| 1990's | 1.52 | 1.49 | 1.40 | 1.52 | 1.45 | 1.52 | 1.67 | |||
| 2000's | 1.59 | 1.89 | 1.48 | 1.50 | 1.55 | 1.66 | 1.81 | 1.78 | 1.78 | 1.79 |
| 2010's | 1.65 | 1.79 | 1.85 | 1.69 | 1.57 | 1.56 | 1.66 | 1.90 | 1.62 | 1.74 |
| 2020's | 1.76 | 1.75 | 1.80 | 1.80 | 1.78 |
| - = No Data Reported; -- = Not Applicable; NA = Not Available; W = Withheld to avoid disclosure of individual company data. |
| Release Date: 5/29/2026 |
| Next Release Date: 6/30/2026 |