|
Download Data (XLS File) |
|
|||||
|
|||||
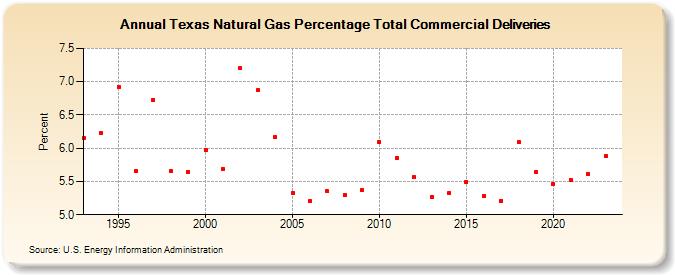
| Texas Natural Gas Percentage Total Commercial Deliveries (Percent) | |||||
| Decade | Year-0 | Year-1 | Year-2 | Year-3 | Year-4 | Year-5 | Year-6 | Year-7 | Year-8 | Year-9 |
|---|---|---|---|---|---|---|---|---|---|---|
| 1990's | 6.15 | 6.23 | 6.92 | 5.65 | 6.73 | 5.66 | 5.64 | |||
| 2000's | 5.98 | 5.69 | 7.20 | 6.87 | 6.17 | 5.33 | 5.20 | 5.35 | 5.30 | 5.37 |
| 2010's | 6.09 | 5.85 | 5.57 | 5.27 | 5.33 | 5.49 | 5.28 | 5.21 | 6.09 | 5.64 |
| 2020's | 5.46 | 5.52 | 5.61 | 5.84 | 5.83 |
| - = No Data Reported; -- = Not Applicable; NA = Not Available; W = Withheld to avoid disclosure of individual company data. |
| Release Date: 5/29/2026 |
| Next Release Date: 6/30/2026 |