|
Download Data (XLS File) |
|
|||||
|
|||||
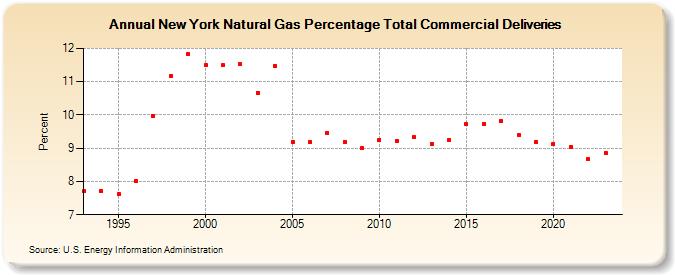
| New York Natural Gas Percentage Total Commercial Deliveries (Percent) | |||||
| Decade | Year-0 | Year-1 | Year-2 | Year-3 | Year-4 | Year-5 | Year-6 | Year-7 | Year-8 | Year-9 |
|---|---|---|---|---|---|---|---|---|---|---|
| 1990's | 7.71 | 7.71 | 7.63 | 8.01 | 9.98 | 11.18 | 11.83 | |||
| 2000's | 11.50 | 11.49 | 11.52 | 10.67 | 11.48 | 9.19 | 9.18 | 9.46 | 9.20 | 9.00 |
| 2010's | 9.26 | 9.23 | 9.33 | 9.13 | 9.24 | 9.72 | 9.73 | 9.81 | 9.40 | 9.18 |
| 2020's | 9.14 | 9.05 | 8.66 | 8.85 | 8.56 |
| - = No Data Reported; -- = Not Applicable; NA = Not Available; W = Withheld to avoid disclosure of individual company data. |
| Release Date: 5/29/2026 |
| Next Release Date: 6/30/2026 |