|
Download Data (XLS File) |
|
|||||
|
|||||
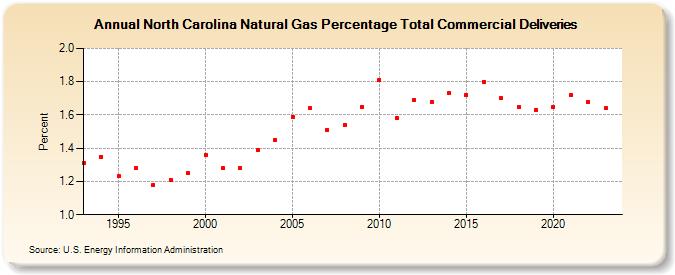
| North Carolina Natural Gas Percentage Total Commercial Deliveries (Percent) | |||||
| Decade | Year-0 | Year-1 | Year-2 | Year-3 | Year-4 | Year-5 | Year-6 | Year-7 | Year-8 | Year-9 |
|---|---|---|---|---|---|---|---|---|---|---|
| 1990's | 1.31 | 1.35 | 1.23 | 1.28 | 1.18 | 1.21 | 1.25 | |||
| 2000's | 1.36 | 1.28 | 1.28 | 1.39 | 1.45 | 1.59 | 1.64 | 1.51 | 1.54 | 1.65 |
| 2010's | 1.81 | 1.58 | 1.69 | 1.68 | 1.73 | 1.72 | 1.80 | 1.70 | 1.65 | 1.63 |
| 2020's | 1.65 | 1.72 | 1.68 | 1.65 | 2.04 |
| - = No Data Reported; -- = Not Applicable; NA = Not Available; W = Withheld to avoid disclosure of individual company data. |
| Release Date: 5/29/2026 |
| Next Release Date: 6/30/2026 |