|
Download Data (XLS File) |
|
|||||
|
|||||
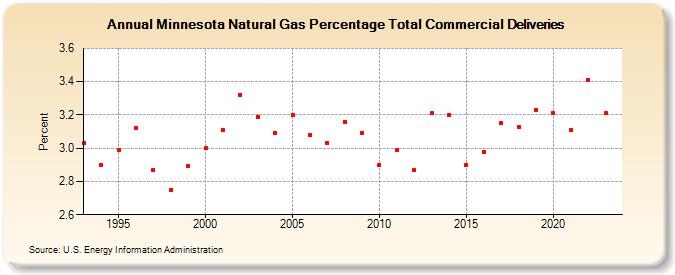
| Minnesota Natural Gas Percentage Total Commercial Deliveries (Percent) | |||||
| Decade | Year-0 | Year-1 | Year-2 | Year-3 | Year-4 | Year-5 | Year-6 | Year-7 | Year-8 | Year-9 |
|---|---|---|---|---|---|---|---|---|---|---|
| 1990's | 3.03 | 2.90 | 2.99 | 3.12 | 2.87 | 2.75 | 2.89 | |||
| 2000's | 3.00 | 3.11 | 3.32 | 3.19 | 3.09 | 3.20 | 3.08 | 3.03 | 3.16 | 3.09 |
| 2010's | 2.90 | 2.99 | 2.87 | 3.21 | 3.20 | 2.90 | 2.98 | 3.15 | 3.13 | 3.23 |
| 2020's | 3.21 | 3.11 | 3.41 | 3.22 | 2.91 |
| - = No Data Reported; -- = Not Applicable; NA = Not Available; W = Withheld to avoid disclosure of individual company data. |
| Release Date: 5/29/2026 |
| Next Release Date: 6/30/2026 |