|
Download Data (XLS File) |
|
|||||
|
|||||
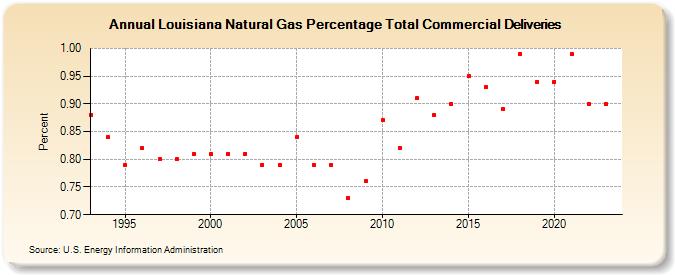
| Louisiana Natural Gas Percentage Total Commercial Deliveries (Percent) | |||||
| Decade | Year-0 | Year-1 | Year-2 | Year-3 | Year-4 | Year-5 | Year-6 | Year-7 | Year-8 | Year-9 |
|---|---|---|---|---|---|---|---|---|---|---|
| 1990's | 0.88 | 0.84 | 0.79 | 0.82 | 0.80 | 0.80 | 0.81 | |||
| 2000's | 0.81 | 0.81 | 0.81 | 0.79 | 0.79 | 0.84 | 0.79 | 0.79 | 0.73 | 0.76 |
| 2010's | 0.87 | 0.82 | 0.91 | 0.88 | 0.90 | 0.95 | 0.93 | 0.89 | 0.99 | 0.94 |
| 2020's | 0.94 | 0.99 | 0.90 | 0.90 | 0.88 |
| - = No Data Reported; -- = Not Applicable; NA = Not Available; W = Withheld to avoid disclosure of individual company data. |
| Release Date: 5/29/2026 |
| Next Release Date: 6/30/2026 |