|
Download Data (XLS File) |
|
|||||
|
|||||
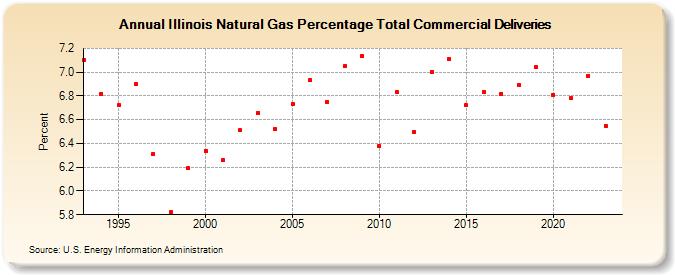
| Illinois Natural Gas Percentage Total Commercial Deliveries (Percent) | |||||
| Decade | Year-0 | Year-1 | Year-2 | Year-3 | Year-4 | Year-5 | Year-6 | Year-7 | Year-8 | Year-9 |
|---|---|---|---|---|---|---|---|---|---|---|
| 1990's | 7.10 | 6.82 | 6.72 | 6.90 | 6.31 | 5.82 | 6.19 | |||
| 2000's | 6.34 | 6.26 | 6.51 | 6.66 | 6.52 | 6.73 | 6.93 | 6.75 | 7.05 | 7.14 |
| 2010's | 6.38 | 6.83 | 6.50 | 7.00 | 7.11 | 6.72 | 6.83 | 6.82 | 6.89 | 7.04 |
| 2020's | 6.81 | 6.78 | 6.97 | 6.57 | 6.30 |
| - = No Data Reported; -- = Not Applicable; NA = Not Available; W = Withheld to avoid disclosure of individual company data. |
| Release Date: 5/29/2026 |
| Next Release Date: 6/30/2026 |