|
Download Data (XLS File) |
|
|||||
|
|||||
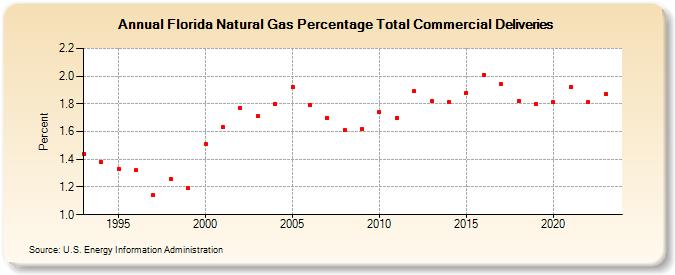
| Florida Natural Gas Percentage Total Commercial Deliveries (Percent) | |||||
| Decade | Year-0 | Year-1 | Year-2 | Year-3 | Year-4 | Year-5 | Year-6 | Year-7 | Year-8 | Year-9 |
|---|---|---|---|---|---|---|---|---|---|---|
| 1990's | 1.44 | 1.38 | 1.33 | 1.32 | 1.14 | 1.26 | 1.19 | |||
| 2000's | 1.51 | 1.63 | 1.77 | 1.71 | 1.80 | 1.92 | 1.79 | 1.70 | 1.61 | 1.62 |
| 2010's | 1.74 | 1.70 | 1.89 | 1.82 | 1.81 | 1.88 | 2.01 | 1.94 | 1.82 | 1.80 |
| 2020's | 1.81 | 1.92 | 1.81 | 1.88 | 2.04 |
| - = No Data Reported; -- = Not Applicable; NA = Not Available; W = Withheld to avoid disclosure of individual company data. |
| Release Date: 5/29/2026 |
| Next Release Date: 6/30/2026 |