|
Download Data (XLS File) |
|
|||||
|
|||||
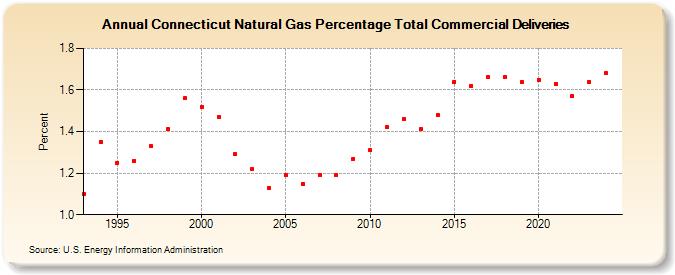
| Connecticut Natural Gas Percentage Total Commercial Deliveries (Percent) | |||||
| Decade | Year-0 | Year-1 | Year-2 | Year-3 | Year-4 | Year-5 | Year-6 | Year-7 | Year-8 | Year-9 |
|---|---|---|---|---|---|---|---|---|---|---|
| 1990's | 1.10 | 1.35 | 1.25 | 1.26 | 1.33 | 1.41 | 1.56 | |||
| 2000's | 1.52 | 1.47 | 1.29 | 1.22 | 1.13 | 1.19 | 1.15 | 1.19 | 1.19 | 1.27 |
| 2010's | 1.31 | 1.42 | 1.46 | 1.41 | 1.48 | 1.64 | 1.62 | 1.66 | 1.66 | 1.64 |
| 2020's | 1.65 | 1.63 | 1.57 | 1.64 | 1.68 |
| - = No Data Reported; -- = Not Applicable; NA = Not Available; W = Withheld to avoid disclosure of individual company data. |
| Release Date: 5/29/2026 |
| Next Release Date: 6/30/2026 |