|
Download Data (XLS File) |
|
|||||
|
|||||
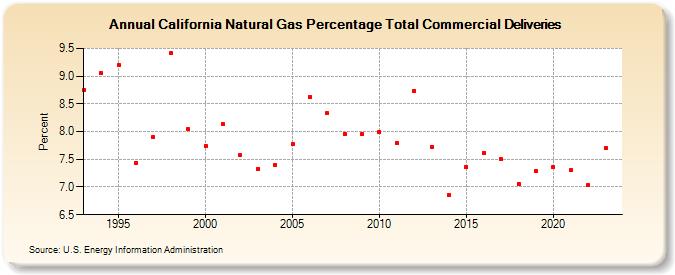
| California Natural Gas Percentage Total Commercial Deliveries (Percent) | |||||
| Decade | Year-0 | Year-1 | Year-2 | Year-3 | Year-4 | Year-5 | Year-6 | Year-7 | Year-8 | Year-9 |
|---|---|---|---|---|---|---|---|---|---|---|
| 1990's | 8.75 | 9.05 | 9.20 | 7.44 | 7.90 | 9.41 | 8.04 | |||
| 2000's | 7.74 | 8.13 | 7.58 | 7.33 | 7.40 | 7.77 | 8.63 | 8.33 | 7.96 | 7.95 |
| 2010's | 7.99 | 7.80 | 8.74 | 7.73 | 6.86 | 7.36 | 7.62 | 7.50 | 7.06 | 7.28 |
| 2020's | 7.36 | 7.30 | 7.03 | 7.73 | 8.62 |
| - = No Data Reported; -- = Not Applicable; NA = Not Available; W = Withheld to avoid disclosure of individual company data. |
| Release Date: 5/29/2026 |
| Next Release Date: 6/30/2026 |