|
Download Data (XLS File) |
|
|||||
|
|||||
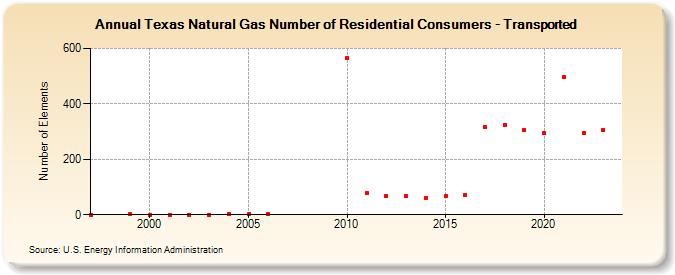
| Texas Natural Gas Number of Residential Consumers - Transported (Number of Elements) | |||||
| Decade | Year-0 | Year-1 | Year-2 | Year-3 | Year-4 | Year-5 | Year-6 | Year-7 | Year-8 | Year-9 |
|---|---|---|---|---|---|---|---|---|---|---|
| 1990's | 0 | 1 | ||||||||
| 2000's | 0 | 0 | 0 | 0 | 1 | 1 | 1 | |||
| 2010's | 566 | 80 | 67 | 66 | 62 | 66 | 72 | 317 | 324 | 306 |
| 2020's | 295 | 496 | 295 | 307 | 297 |
| - = No Data Reported; -- = Not Applicable; NA = Not Available; W = Withheld to avoid disclosure of individual company data. |
| Release Date: 6/30/2026 |
| Next Release Date: 7/31/2026 |