|
Download Data (XLS File) |
|
|||||
|
|||||
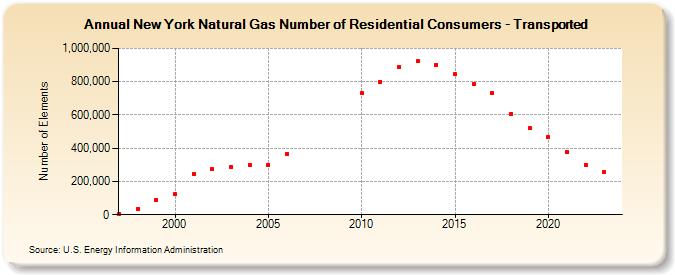
| New York Natural Gas Number of Residential Consumers - Transported (Number of Elements) | |||||
| Decade | Year-0 | Year-1 | Year-2 | Year-3 | Year-4 | Year-5 | Year-6 | Year-7 | Year-8 | Year-9 |
|---|---|---|---|---|---|---|---|---|---|---|
| 1990's | 5,765 | 35,872 | 90,778 | |||||||
| 2000's | 123,399 | 246,876 | 274,863 | 287,984 | 300,158 | 300,414 | 365,053 | |||
| 2010's | 731,306 | 800,777 | 886,062 | 921,513 | 902,908 | 843,736 | 786,619 | 731,421 | 607,807 | 521,077 |
| 2020's | 466,907 | 375,723 | 299,077 | 255,234 | 235,992 |
| - = No Data Reported; -- = Not Applicable; NA = Not Available; W = Withheld to avoid disclosure of individual company data. |
| Release Date: 6/30/2026 |
| Next Release Date: 7/31/2026 |