|
Download Data (XLS File) |
|
|||||
|
|||||
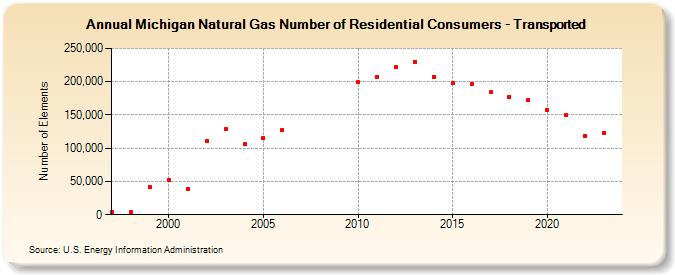
| Michigan Natural Gas Number of Residential Consumers - Transported (Number of Elements) | |||||
| Decade | Year-0 | Year-1 | Year-2 | Year-3 | Year-4 | Year-5 | Year-6 | Year-7 | Year-8 | Year-9 |
|---|---|---|---|---|---|---|---|---|---|---|
| 1990's | 3,707 | 4,235 | 42,017 | |||||||
| 2000's | 51,768 | 38,657 | 110,716 | 128,942 | 105,568 | 115,085 | 127,378 | |||
| 2010's | 199,918 | 207,388 | 221,340 | 230,034 | 207,492 | 197,362 | 195,989 | 185,028 | 177,566 | 173,128 |
| 2020's | 157,335 | 149,218 | 118,535 | 122,240 | 115,337 |
| - = No Data Reported; -- = Not Applicable; NA = Not Available; W = Withheld to avoid disclosure of individual company data. |
| Release Date: 6/30/2026 |
| Next Release Date: 7/31/2026 |