|
Download Data (XLS File) |
|
|||||
|
|||||
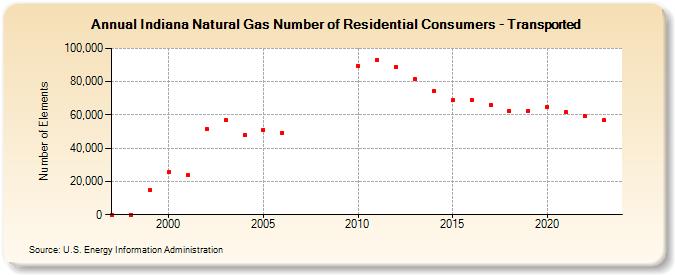
| Indiana Natural Gas Number of Residential Consumers - Transported (Number of Elements) | |||||
| Decade | Year-0 | Year-1 | Year-2 | Year-3 | Year-4 | Year-5 | Year-6 | Year-7 | Year-8 | Year-9 |
|---|---|---|---|---|---|---|---|---|---|---|
| 1990's | 0 | 2 | 14,877 | |||||||
| 2000's | 25,382 | 23,650 | 51,731 | 56,976 | 47,789 | 51,051 | 49,397 | |||
| 2010's | 89,675 | 93,106 | 88,977 | 81,475 | 74,440 | 68,799 | 69,078 | 66,033 | 62,371 | 62,565 |
| 2020's | 64,754 | 61,563 | 59,345 | 56,706 | 54,016 |
| - = No Data Reported; -- = Not Applicable; NA = Not Available; W = Withheld to avoid disclosure of individual company data. |
| Release Date: 6/30/2026 |
| Next Release Date: 7/31/2026 |