|
Download Data (XLS File) |
|
|||||
|
|||||
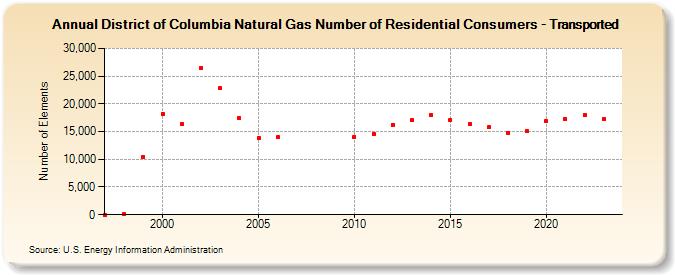
| District of Columbia Natural Gas Number of Residential Consumers - Transported (Number of Elements) | |||||
| Decade | Year-0 | Year-1 | Year-2 | Year-3 | Year-4 | Year-5 | Year-6 | Year-7 | Year-8 | Year-9 |
|---|---|---|---|---|---|---|---|---|---|---|
| 1990's | 0 | 43 | 10,492 | |||||||
| 2000's | 18,249 | 16,378 | 26,430 | 22,772 | 17,425 | 13,873 | 13,933 | |||
| 2010's | 14,103 | 14,636 | 16,264 | 17,071 | 17,935 | 17,097 | 16,324 | 15,762 | 14,828 | 15,012 |
| 2020's | 16,889 | 17,348 | 18,021 | 17,220 | 16,667 |
| - = No Data Reported; -- = Not Applicable; NA = Not Available; W = Withheld to avoid disclosure of individual company data. |
| Release Date: 6/30/2026 |
| Next Release Date: 7/31/2026 |