|
Download Data (XLS File) |
|
|||||
|
|||||
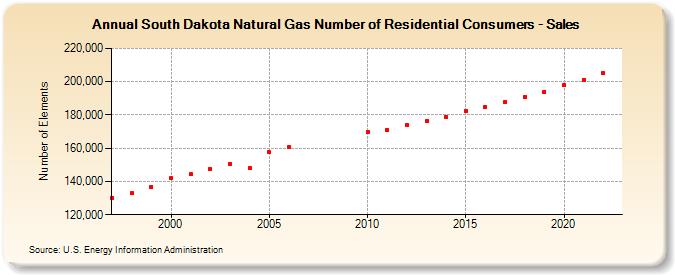
| South Dakota Natural Gas Number of Residential Consumers - Sales (Number of Elements) | |||||
| Decade | Year-0 | Year-1 | Year-2 | Year-3 | Year-4 | Year-5 | Year-6 | Year-7 | Year-8 | Year-9 |
|---|---|---|---|---|---|---|---|---|---|---|
| 1990's | 130,306 | 133,095 | 136,789 | |||||||
| 2000's | 142,075 | 144,310 | 147,356 | 150,725 | 148,105 | 157,457 | 160,481 | |||
| 2010's | 169,838 | 170,877 | 173,856 | 176,204 | 179,042 | 182,568 | 184,831 | 187,789 | 190,982 | 194,067 |
| 2020's | 197,769 | 201,101 | 205,119 | 208,985 | 212,508 |
| - = No Data Reported; -- = Not Applicable; NA = Not Available; W = Withheld to avoid disclosure of individual company data. |
| Release Date: 6/30/2026 |
| Next Release Date: 7/31/2026 |