|
Download Data (XLS File) |
|
|||||
|
|||||
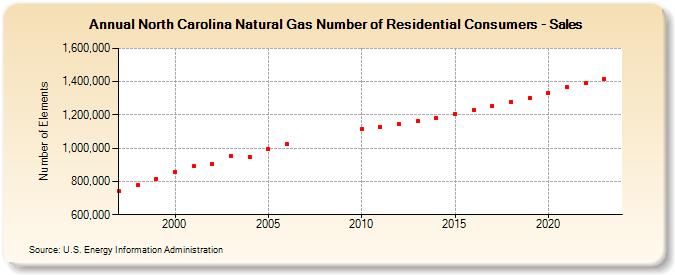
| North Carolina Natural Gas Number of Residential Consumers - Sales (Number of Elements) | |||||
| Decade | Year-0 | Year-1 | Year-2 | Year-3 | Year-4 | Year-5 | Year-6 | Year-7 | Year-8 | Year-9 |
|---|---|---|---|---|---|---|---|---|---|---|
| 1990's | 740,013 | 777,805 | 815,908 | |||||||
| 2000's | 858,004 | 891,227 | 905,816 | 953,732 | 948,283 | 992,906 | 1,022,430 | |||
| 2010's | 1,115,532 | 1,128,963 | 1,142,947 | 1,161,398 | 1,183,152 | 1,206,870 | 1,231,366 | 1,255,541 | 1,279,791 | 1,304,584 |
| 2020's | 1,331,848 | 1,367,653 | 1,389,857 | 1,414,844 | 1,444,353 |
| - = No Data Reported; -- = Not Applicable; NA = Not Available; W = Withheld to avoid disclosure of individual company data. |
| Release Date: 6/30/2026 |
| Next Release Date: 7/31/2026 |