|
Download Data (XLS File) |
|
|||||
|
|||||
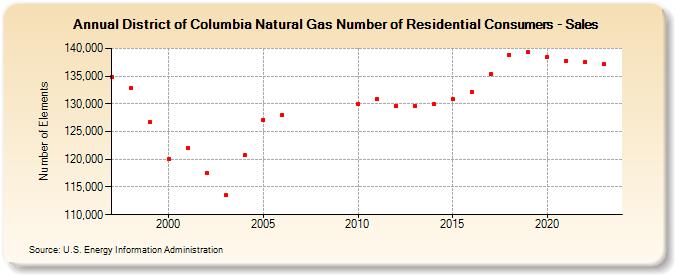
| District of Columbia Natural Gas Number of Residential Consumers - Sales (Number of Elements) | |||||
| Decade | Year-0 | Year-1 | Year-2 | Year-3 | Year-4 | Year-5 | Year-6 | Year-7 | Year-8 | Year-9 |
|---|---|---|---|---|---|---|---|---|---|---|
| 1990's | 134,807 | 132,824 | 126,714 | |||||||
| 2000's | 120,003 | 122,034 | 117,444 | 113,486 | 120,709 | 127,139 | 128,020 | |||
| 2010's | 130,048 | 130,888 | 129,674 | 129,641 | 129,942 | 130,798 | 132,221 | 135,363 | 138,863 | 139,363 |
| 2020's | 138,405 | 137,743 | 137,617 | 137,119 | 136,894 |
| - = No Data Reported; -- = Not Applicable; NA = Not Available; W = Withheld to avoid disclosure of individual company data. |
| Release Date: 6/30/2026 |
| Next Release Date: 7/31/2026 |