|
Download Data (XLS File) |
|
||||||||
|
||||||||
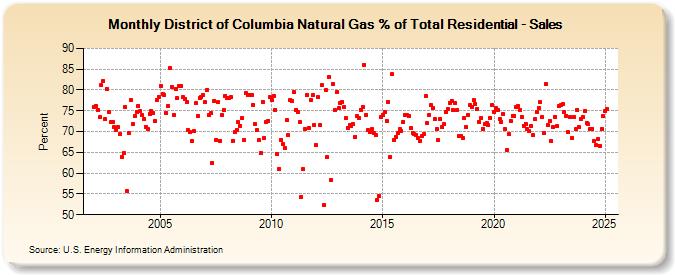
| District of Columbia Natural Gas % of Total Residential - Sales (Percent) | ||||||||
| Year | Jan | Feb | Mar | Apr | May | Jun | Jul | Aug | Sep | Oct | Nov | Dec |
|---|---|---|---|---|---|---|---|---|---|---|---|---|
| 2002 | 76.0 | 76.2 | 75.3 | 73.4 | 81.1 | 82.2 | 72.9 | 80.3 | 74.6 | 72.2 | 72.3 | 71.0 |
| 2003 | 70.4 | 71.0 | 69.3 | 63.9 | 64.8 | 75.9 | 55.6 | 69.6 | 77.6 | 71.8 | 73.7 | 74.8 |
| 2004 | 76.1 | 74.9 | 74.1 | 72.9 | 71.1 | 70.5 | 74.3 | 74.9 | 74.5 | 72.5 | 77.7 | 78.4 |
| 2005 | 81.0 | 79.1 | 78.9 | 74.5 | 76.2 | 85.2 | 80.8 | 74.1 | 80.3 | 78.0 | 81.0 | 81.0 |
| 2006 | 78.2 | 77.9 | 77.1 | 70.3 | 69.8 | 67.8 | 70.1 | 76.8 | 73.8 | 78.1 | 78.2 | 78.7 |
| 2007 | 77.0 | 80.1 | 73.9 | 74.4 | 62.5 | 77.4 | 68.0 | 77.1 | 67.8 | 74.0 | 75.2 | 78.5 |
| 2008 | 78.0 | 78.1 | 78.2 | 67.8 | 69.9 | 70.3 | 72.2 | 71.4 | 73.2 | 68.0 | 79.2 | 78.9 |
| 2009 | 78.8 | 78.7 | 76.5 | 71.7 | 70.4 | 67.9 | 64.8 | 77.2 | 68.5 | 72.4 | 72.6 | 78.2 |
| 2010 | 77.6 | 78.6 | 75.3 | 64.5 | 61.1 | 68.0 | 66.9 | 66.1 | 72.7 | 69.1 | 77.7 | 77.3 |
| 2011 | 79.4 | 75.3 | 74.8 | 72.3 | 54.3 | 60.9 | 70.6 | 78.8 | 70.9 | 77.6 | 78.7 | 71.5 |
| 2012 | 66.8 | 78.2 | 71.5 | 81.1 | 52.3 | 79.9 | 63.8 | 83.0 | 58.3 | 81.4 | 75.1 | 79.5 |
| 2013 | 75.6 | 76.8 | 77.2 | 76.0 | 73.2 | 70.9 | 71.6 | 71.4 | 71.7 | 68.7 | 73.7 | 73.3 |
| 2014 | 75.2 | 76.0 | 86.1 | 74.1 | 70.3 | 69.8 | 70.6 | 69.6 | 69.2 | 53.6 | 54.4 | 73.6 |
| 2015 | 74.1 | 74.7 | 72.6 | 77.1 | 63.9 | 83.8 | 68.0 | 68.8 | 69.6 | 70.6 | 70.2 | 72.4 |
| 2016 | 73.9 | 74.0 | 73.8 | 70.8 | 69.7 | 69.3 | 69.2 | 68.4 | 67.7 | 68.9 | 69.3 | 78.5 |
| 2017 | 72.0 | 74.1 | 76.4 | 75.6 | 73.0 | 70.7 | 67.9 | 73.0 | 71.0 | 71.7 | 74.7 | 75.4 |
| 2018 | 76.9 | 77.4 | 75.1 | 76.9 | 75.2 | 69.0 | 68.9 | 68.5 | 73.2 | 71.1 | 74.0 | 76.3 |
| 2019 | 75.8 | 77.5 | 76.6 | 75.5 | 72.3 | 73.2 | 70.7 | 71.8 | 72.0 | 71.5 | 73.3 | 76.3 |
| 2020 | 74.8 | 75.6 | 75.2 | 72.9 | 72.4 | 74.2 | 70.5 | 65.5 | 69.4 | 72.6 | 73.8 | 73.7 |
| 2021 | 76.0 | 76.1 | 75.3 | 73.5 | 71.4 | 71.9 | 70.6 | 70.1 | 71.4 | 69.1 | 72.9 | 74.8 |
| 2022 | 75.7 | 77.0 | 73.5 | 69.6 | 81.4 | 71.5 | 72.6 | 67.7 | 71.0 | 73.6 | 71.3 | 76.1 |
| 2023 | 76.4 | 76.6 | 74.6 | 73.8 | 69.8 | 73.5 | 68.4 | 73.6 | 70.6 | 75.3 | 71.0 | 73.0 |
| 2024 | 73.5 | 75.0 | 72.1 | 71.7 | 70.6 | 70.7 | 67.7 | 66.7 | 68.1 | 66.6 | 70.6 | 73.7 |
| 2025 | 75.0 | 75.4 | 74.0 | 69.9 | 69.6 | 71.1 | 68.2 | 69.8 | 71.2 | 69.7 | 73.5 | 74.1 |
| 2026 | 75.6 | 76.7 | 73.9 | 72.2 | 73.7 | |||||||
| - = No Data Reported; -- = Not Applicable; NA = Not Available; W = Withheld to avoid disclosure of individual company data. |
| Release Date: 7/31/2026 |
| Next Release Date: 8/31/2026 |