|
Download Data (XLS File) |
|
|||||
|
|||||
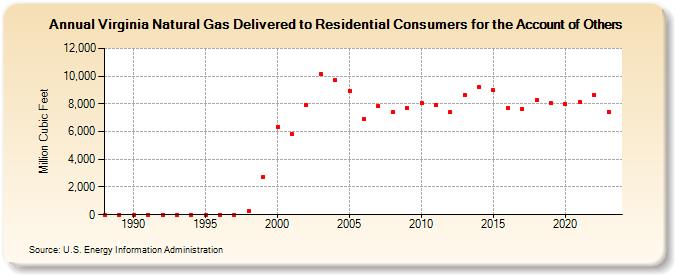
| Virginia Natural Gas Delivered to Residential Consumers for the Account of Others (Million Cubic Feet) | |||||
| Decade | Year-0 | Year-1 | Year-2 | Year-3 | Year-4 | Year-5 | Year-6 | Year-7 | Year-8 | Year-9 |
|---|---|---|---|---|---|---|---|---|---|---|
| 1980's | 0 | 0 | ||||||||
| 1990's | 0 | 0 | 0 | 0 | 0 | 0 | 0 | 0 | 234 | 2,743 |
| 2000's | 6,349 | 5,835 | 7,897 | 10,167 | 9,739 | 8,956 | 6,910 | 7,863 | 7,396 | 7,717 |
| 2010's | 8,048 | 7,882 | 7,402 | 8,655 | 9,211 | 8,973 | 7,674 | 7,663 | 8,274 | 8,055 |
| 2020's | 7,987 | 8,099 | 8,657 | 7,441 | 7,199 |
| - = No Data Reported; -- = Not Applicable; NA = Not Available; W = Withheld to avoid disclosure of individual company data. |
| Release Date: 6/30/2026 |
| Next Release Date: 7/31/2026 |