|
Download Data (XLS File) |
|
|||||
|
|||||
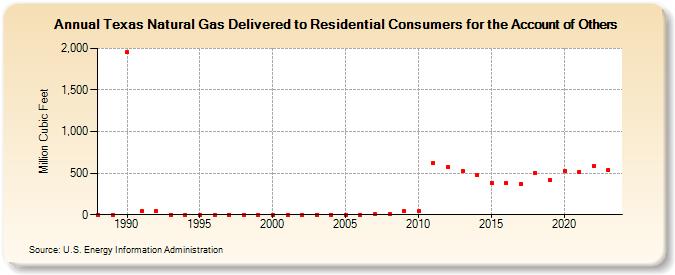
| Texas Natural Gas Delivered to Residential Consumers for the Account of Others (Million Cubic Feet) | |||||
| Decade | Year-0 | Year-1 | Year-2 | Year-3 | Year-4 | Year-5 | Year-6 | Year-7 | Year-8 | Year-9 |
|---|---|---|---|---|---|---|---|---|---|---|
| 1980's | 0 | 0 | ||||||||
| 1990's | 1,951 | 43 | 43 | 0 | 0 | 0 | 0 | 0 | 0 | 0 |
| 2000's | 0 | 0 | 0 | 0 | 2 | 2 | 2 | 4 | 4 | 47 |
| 2010's | 39 | 622 | 568 | 527 | 481 | 387 | 383 | 374 | 500 | 415 |
| 2020's | 527 | 519 | 586 | 540 | 562 |
| - = No Data Reported; -- = Not Applicable; NA = Not Available; W = Withheld to avoid disclosure of individual company data. |
| Release Date: 6/30/2026 |
| Next Release Date: 7/31/2026 |