|
Download Data (XLS File) |
|
|||||
|
|||||
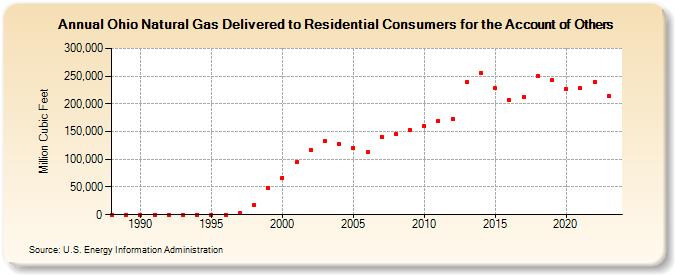
| Ohio Natural Gas Delivered to Residential Consumers for the Account of Others (Million Cubic Feet) | |||||
| Decade | Year-0 | Year-1 | Year-2 | Year-3 | Year-4 | Year-5 | Year-6 | Year-7 | Year-8 | Year-9 |
|---|---|---|---|---|---|---|---|---|---|---|
| 1980's | 0 | 0 | ||||||||
| 1990's | 0 | 0 | 81 | 0 | 0 | 0 | 0 | 3,477 | 17,184 | 48,252 |
| 2000's | 66,766 | 94,222 | 117,002 | 132,768 | 127,599 | 120,351 | 112,252 | 140,783 | 145,698 | 152,735 |
| 2010's | 159,730 | 169,345 | 173,395 | 238,498 | 256,394 | 228,054 | 206,924 | 212,814 | 250,584 | 242,340 |
| 2020's | 227,632 | 228,008 | 239,968 | 214,380 | 207,934 |
| - = No Data Reported; -- = Not Applicable; NA = Not Available; W = Withheld to avoid disclosure of individual company data. |
| Release Date: 6/30/2026 |
| Next Release Date: 7/31/2026 |