|
Download Data (XLS File) |
|
|||||
|
|||||
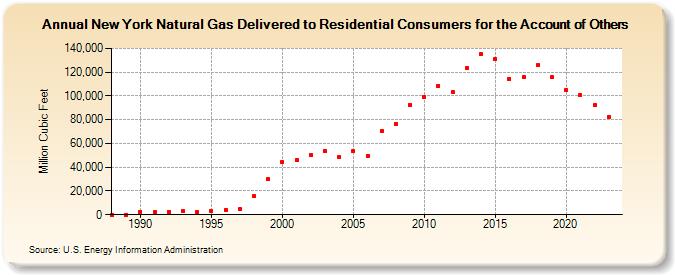
| New York Natural Gas Delivered to Residential Consumers for the Account of Others (Million Cubic Feet) | |||||
| Decade | Year-0 | Year-1 | Year-2 | Year-3 | Year-4 | Year-5 | Year-6 | Year-7 | Year-8 | Year-9 |
|---|---|---|---|---|---|---|---|---|---|---|
| 1980's | 0 | 0 | ||||||||
| 1990's | 2,660 | 2,631 | 2,413 | 3,036 | 2,369 | 3,019 | 3,840 | 4,525 | 15,356 | 30,012 |
| 2000's | 44,459 | 46,056 | 50,338 | 53,914 | 48,530 | 53,250 | 49,677 | 70,694 | 76,322 | 92,591 |
| 2010's | 99,147 | 108,666 | 103,013 | 123,774 | 135,207 | 130,710 | 114,419 | 115,744 | 125,815 | 115,546 |
| 2020's | 104,769 | 100,557 | 92,077 | 82,603 | 77,411 |
| - = No Data Reported; -- = Not Applicable; NA = Not Available; W = Withheld to avoid disclosure of individual company data. |
| Release Date: 6/30/2026 |
| Next Release Date: 7/31/2026 |