|
Download Data (XLS File) |
|
|||||
|
|||||
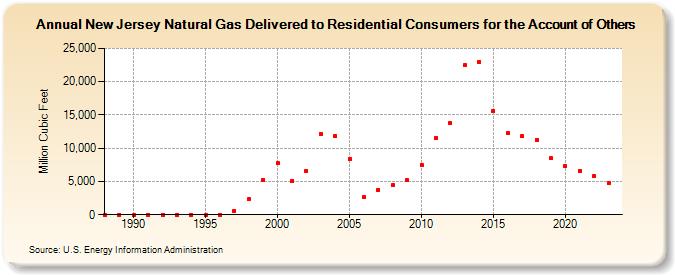
| New Jersey Natural Gas Delivered to Residential Consumers for the Account of Others (Million Cubic Feet) | |||||
| Decade | Year-0 | Year-1 | Year-2 | Year-3 | Year-4 | Year-5 | Year-6 | Year-7 | Year-8 | Year-9 |
|---|---|---|---|---|---|---|---|---|---|---|
| 1980's | 0 | 0 | ||||||||
| 1990's | 0 | 0 | 0 | 0 | 0 | 0 | 0 | 611 | 2,301 | 5,266 |
| 2000's | 7,709 | 5,109 | 6,628 | 12,141 | 11,848 | 8,337 | 2,640 | 3,763 | 4,450 | 5,149 |
| 2010's | 7,523 | 11,520 | 13,754 | 22,452 | 22,978 | 15,626 | 12,263 | 11,783 | 11,247 | 8,475 |
| 2020's | 7,268 | 6,628 | 5,748 | 4,747 | 4,582 |
| - = No Data Reported; -- = Not Applicable; NA = Not Available; W = Withheld to avoid disclosure of individual company data. |
| Release Date: 6/30/2026 |
| Next Release Date: 7/31/2026 |