|
Download Data (XLS File) |
|
|||||
|
|||||
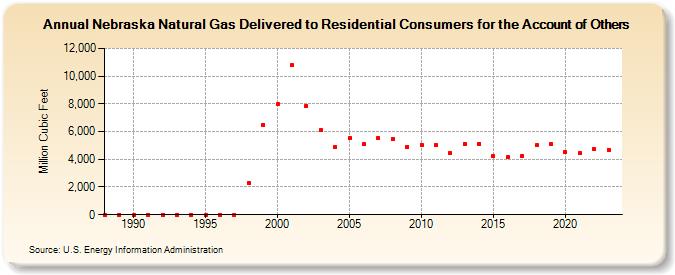
| Nebraska Natural Gas Delivered to Residential Consumers for the Account of Others (Million Cubic Feet) | |||||
| Decade | Year-0 | Year-1 | Year-2 | Year-3 | Year-4 | Year-5 | Year-6 | Year-7 | Year-8 | Year-9 |
|---|---|---|---|---|---|---|---|---|---|---|
| 1980's | 0 | 0 | ||||||||
| 1990's | 0 | 0 | 0 | 0 | 0 | 0 | 0 | 0 | 2,295 | 6,489 |
| 2000's | 7,958 | 10,774 | 7,869 | 6,118 | 4,865 | 5,523 | 5,080 | 5,535 | 5,468 | 4,910 |
| 2010's | 5,063 | 5,047 | 4,440 | 5,136 | 5,138 | 4,216 | 4,135 | 4,251 | 5,009 | 5,122 |
| 2020's | 4,489 | 4,425 | 4,735 | 4,701 | 4,178 |
| - = No Data Reported; -- = Not Applicable; NA = Not Available; W = Withheld to avoid disclosure of individual company data. |
| Release Date: 6/30/2026 |
| Next Release Date: 7/31/2026 |