|
Download Data (XLS File) |
|
|||||
|
|||||
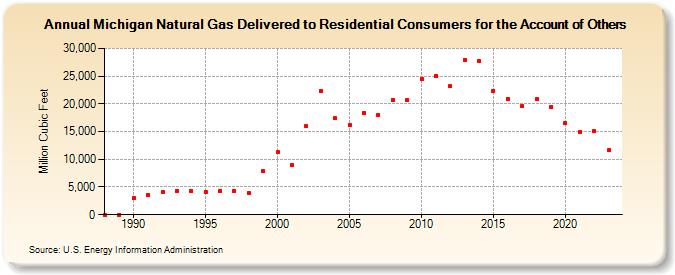
| Michigan Natural Gas Delivered to Residential Consumers for the Account of Others (Million Cubic Feet) | |||||
| Decade | Year-0 | Year-1 | Year-2 | Year-3 | Year-4 | Year-5 | Year-6 | Year-7 | Year-8 | Year-9 |
|---|---|---|---|---|---|---|---|---|---|---|
| 1980's | 0 | 0 | ||||||||
| 1990's | 2,997 | 3,627 | 4,121 | 4,283 | 4,245 | 4,184 | 4,309 | 4,353 | 3,909 | 7,807 |
| 2000's | 11,314 | 8,928 | 15,913 | 22,305 | 17,399 | 16,108 | 18,416 | 18,043 | 20,666 | 20,732 |
| 2010's | 24,539 | 25,037 | 23,162 | 27,948 | 27,703 | 22,369 | 20,941 | 19,647 | 20,809 | 19,498 |
| 2020's | 16,466 | 14,932 | 15,119 | 11,604 | 10,386 |
| - = No Data Reported; -- = Not Applicable; NA = Not Available; W = Withheld to avoid disclosure of individual company data. |
| Release Date: 6/30/2026 |
| Next Release Date: 7/31/2026 |